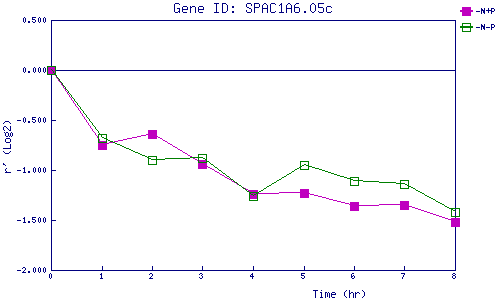
| 0 | 1 | 2 | 3 | 4 | 5 | 6 | 7 | 8 | |
| -N+P | 0.000 | -0.753 | -0.640 | -0.941 | -1.242 | -1.229 | -1.360 | -1.354 | -1.524 |
| -N-P | 0.000 | -0.679 | -0.903 | -0.876 | -1.259 | -0.953 | -1.114 | -1.145 | -1.422 |
|
-N+P: Nitrogen starved in the presence of P-factor -N-P: Nitrogen starved in the absence of P-factor |