| 0 | 1 | 2 | 3 | 4 | 5 | 6 | 7 | 8 | |
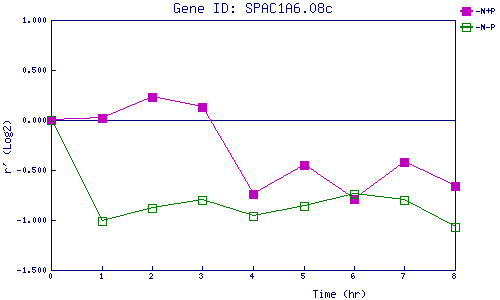
| -N+P | 0.000 | 0.016 | 0.229 | 0.126 | -0.741 | -0.450 | -0.792 | -0.418 | -0.661 |
| -N-P | 0.000 | -1.012 | -0.877 | -0.799 | -0.964 | -0.859 | -0.739 | -0.795 | -1.069 |
|
-N+P: Nitrogen starved in the presence of P-factor -N-P: Nitrogen starved in the absence of P-factor |