lag1
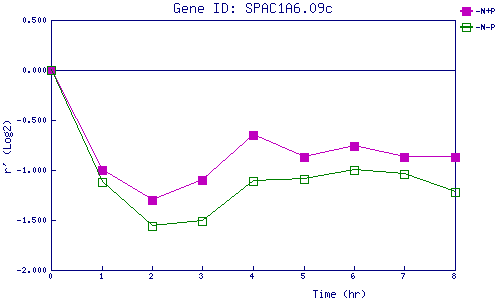
| 0 | 1 | 2 | 3 | 4 | 5 | 6 | 7 | 8 | |
| -N+P | 0.000 | -0.999 | -1.298 | -1.105 | -0.646 | -0.873 | -0.761 | -0.872 | -0.868 |
| -N-P | 0.000 | -1.119 | -1.559 | -1.513 | -1.106 | -1.091 | -1.005 | -1.045 | -1.215 |
|
-N+P: Nitrogen starved in the presence of P-factor -N-P: Nitrogen starved in the absence of P-factor |