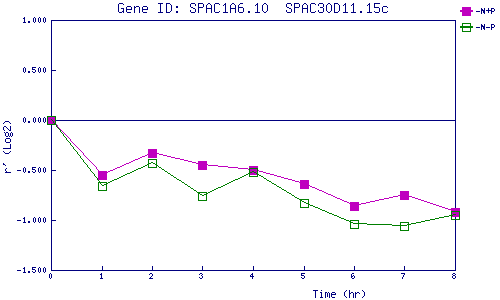
| 0 | 1 | 2 | 3 | 4 | 5 | 6 | 7 | 8 | |
| -N+P | 0.000 | -0.551 | -0.328 | -0.448 | -0.495 | -0.636 | -0.859 | -0.753 | -0.921 |
| -N-P | 0.000 | -0.660 | -0.428 | -0.762 | -0.524 | -0.833 | -1.045 | -1.057 | -0.954 |
|
-N+P: Nitrogen starved in the presence of P-factor -N-P: Nitrogen starved in the absence of P-factor |