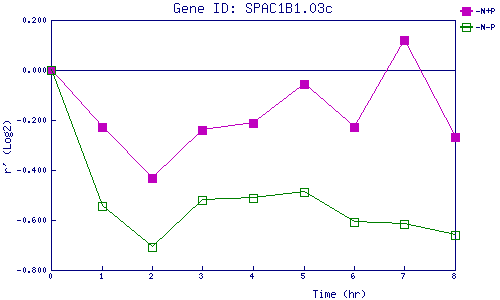
| 0 | 1 | 2 | 3 | 4 | 5 | 6 | 7 | 8 | |
| -N+P | 0.000 | -0.228 | -0.432 | -0.241 | -0.212 | -0.058 | -0.229 | 0.119 | -0.268 |
| -N-P | 0.000 | -0.545 | -0.708 | -0.520 | -0.512 | -0.487 | -0.610 | -0.615 | -0.660 |
|
-N+P: Nitrogen starved in the presence of P-factor -N-P: Nitrogen starved in the absence of P-factor |