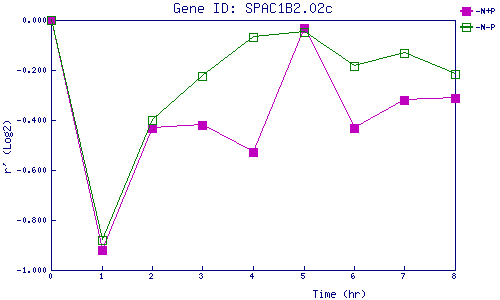
| 0 | 1 | 2 | 3 | 4 | 5 | 6 | 7 | 8 | |
| -N+P | 0.000 | -0.921 | -0.432 | -0.420 | -0.528 | -0.030 | -0.434 | -0.318 | -0.314 |
| -N-P | 0.000 | -0.881 | -0.401 | -0.222 | -0.069 | -0.046 | -0.184 | -0.133 | -0.215 |
|
-N+P: Nitrogen starved in the presence of P-factor -N-P: Nitrogen starved in the absence of P-factor |