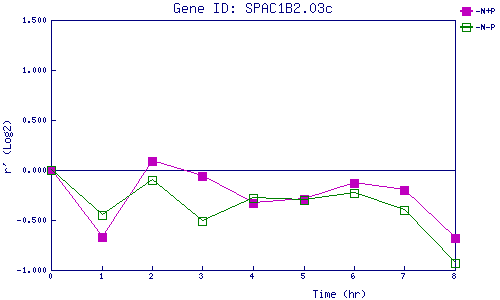
| 0 | 1 | 2 | 3 | 4 | 5 | 6 | 7 | 8 | |
| -N+P | 0.000 | -0.670 | 0.089 | -0.056 | -0.326 | -0.291 | -0.131 | -0.196 | -0.685 |
| -N-P | 0.000 | -0.452 | -0.099 | -0.510 | -0.275 | -0.301 | -0.232 | -0.397 | -0.928 |
|
-N+P: Nitrogen starved in the presence of P-factor -N-P: Nitrogen starved in the absence of P-factor |