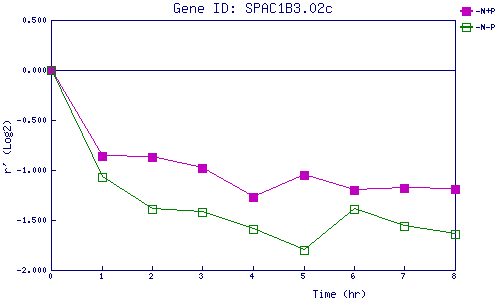
| 0 | 1 | 2 | 3 | 4 | 5 | 6 | 7 | 8 | |
| -N+P | 0.000 | -0.857 | -0.866 | -0.982 | -1.267 | -1.053 | -1.201 | -1.183 | -1.191 |
| -N-P | 0.000 | -1.073 | -1.390 | -1.417 | -1.594 | -1.801 | -1.391 | -1.556 | -1.644 |
|
-N+P: Nitrogen starved in the presence of P-factor -N-P: Nitrogen starved in the absence of P-factor |