wis2 cyp5
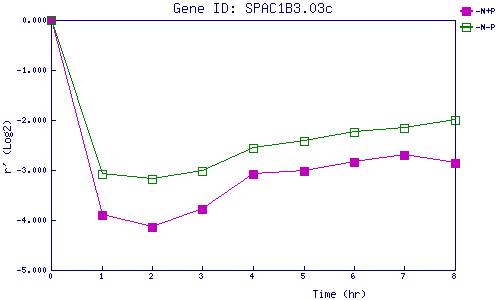
| 0 | 1 | 2 | 3 | 4 | 5 | 6 | 7 | 8 | |
| -N+P | 0.000 | -3.897 | -4.144 | -3.779 | -3.081 | -3.024 | -2.839 | -2.691 | -2.864 |
| -N-P | 0.000 | -3.070 | -3.187 | -3.024 | -2.569 | -2.429 | -2.239 | -2.158 | -1.993 |
|
-N+P: Nitrogen starved in the presence of P-factor -N-P: Nitrogen starved in the absence of P-factor |