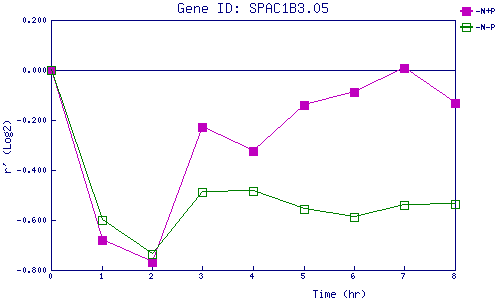
| 0 | 1 | 2 | 3 | 4 | 5 | 6 | 7 | 8 | |
| -N+P | 0.000 | -0.680 | -0.770 | -0.228 | -0.323 | -0.141 | -0.087 | 0.009 | -0.133 |
| -N-P | 0.000 | -0.601 | -0.738 | -0.486 | -0.485 | -0.555 | -0.587 | -0.541 | -0.534 |
|
-N+P: Nitrogen starved in the presence of P-factor -N-P: Nitrogen starved in the absence of P-factor |