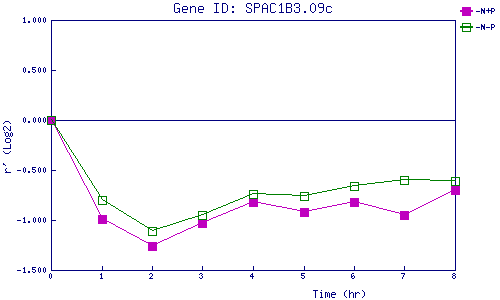
| 0 | 1 | 2 | 3 | 4 | 5 | 6 | 7 | 8 | |
| -N+P | 0.000 | -0.994 | -1.255 | -1.034 | -0.819 | -0.925 | -0.821 | -0.951 | -0.705 |
| -N-P | 0.000 | -0.800 | -1.109 | -0.946 | -0.741 | -0.765 | -0.661 | -0.599 | -0.612 |
|
-N+P: Nitrogen starved in the presence of P-factor -N-P: Nitrogen starved in the absence of P-factor |