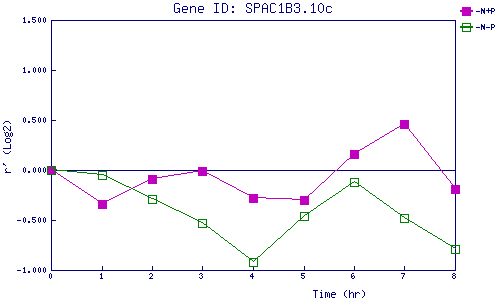
| 0 | 1 | 2 | 3 | 4 | 5 | 6 | 7 | 8 | |
| -N+P | 0.000 | -0.345 | -0.086 | -0.011 | -0.277 | -0.297 | 0.165 | 0.463 | -0.186 |
| -N-P | 0.000 | -0.050 | -0.288 | -0.528 | -0.922 | -0.459 | -0.117 | -0.483 | -0.787 |
|
-N+P: Nitrogen starved in the presence of P-factor -N-P: Nitrogen starved in the absence of P-factor |