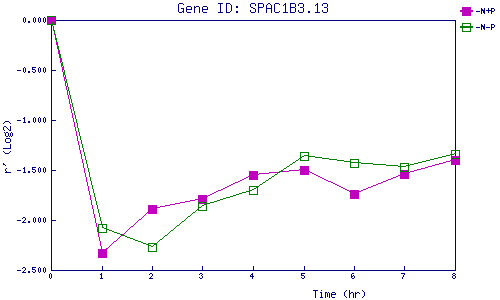
| 0 | 1 | 2 | 3 | 4 | 5 | 6 | 7 | 8 | |
| -N+P | 0.000 | -2.333 | -1.893 | -1.788 | -1.550 | -1.499 | -1.739 | -1.544 | -1.400 |
| -N-P | 0.000 | -2.083 | -2.267 | -1.858 | -1.705 | -1.356 | -1.427 | -1.468 | -1.339 |
|
-N+P: Nitrogen starved in the presence of P-factor -N-P: Nitrogen starved in the absence of P-factor |