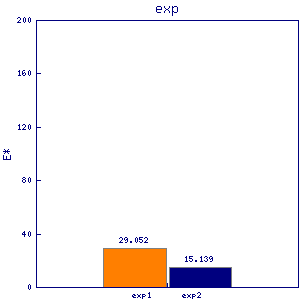
vht1
| 0 | 1 | 2 | 3 | 4 | 5 | 6 | 7 | 8 | |
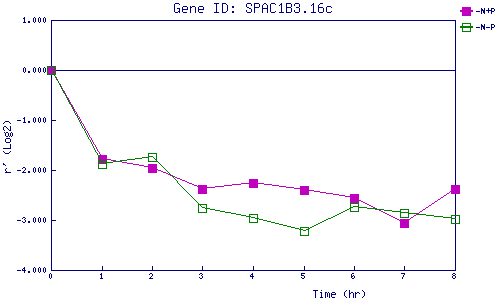
| -N+P | 0.000 | -1.788 | -1.960 | -2.380 | -2.263 | -2.398 | -2.561 | -3.058 | -2.376 |
| -N-P | 0.000 | -1.873 | -1.737 | -2.764 | -2.967 | -3.222 | -2.733 | -2.861 | -2.975 |
|
-N+P: Nitrogen starved in the presence of P-factor -N-P: Nitrogen starved in the absence of P-factor |