| 0 | 1 | 2 | 3 | 4 | 5 | 6 | 7 | 8 | |
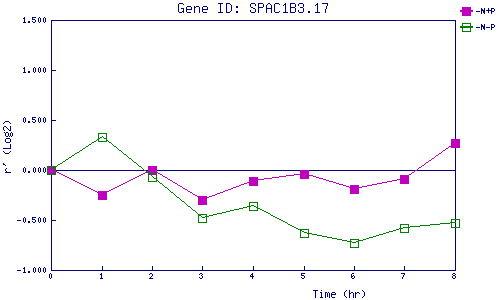
| -N+P | 0.000 | -0.250 | 0.002 | -0.297 | -0.107 | -0.036 | -0.194 | -0.086 | 0.269 |
| -N-P | 0.000 | 0.333 | -0.072 | -0.478 | -0.356 | -0.633 | -0.732 | -0.582 | -0.531 |
|
-N+P: Nitrogen starved in the presence of P-factor -N-P: Nitrogen starved in the absence of P-factor |