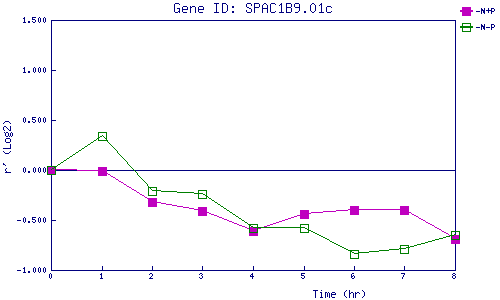
| 0 | 1 | 2 | 3 | 4 | 5 | 6 | 7 | 8 | |
| -N+P | 0.000 | -0.007 | -0.322 | -0.408 | -0.608 | -0.444 | -0.395 | -0.404 | -0.693 |
| -N-P | 0.000 | 0.339 | -0.210 | -0.237 | -0.581 | -0.579 | -0.845 | -0.793 | -0.648 |
|
-N+P: Nitrogen starved in the presence of P-factor -N-P: Nitrogen starved in the absence of P-factor |