cct2
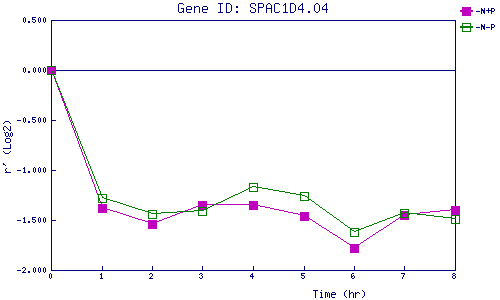
| 0 | 1 | 2 | 3 | 4 | 5 | 6 | 7 | 8 | |
| -N+P | 0.000 | -1.381 | -1.536 | -1.350 | -1.349 | -1.456 | -1.780 | -1.452 | -1.398 |
| -N-P | 0.000 | -1.284 | -1.435 | -1.410 | -1.173 | -1.258 | -1.621 | -1.426 | -1.492 |
|
-N+P: Nitrogen starved in the presence of P-factor -N-P: Nitrogen starved in the absence of P-factor |