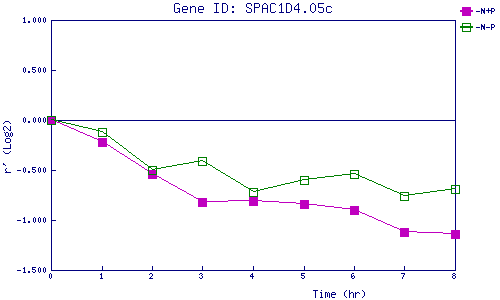
| 0 | 1 | 2 | 3 | 4 | 5 | 6 | 7 | 8 | |
| -N+P | 0.000 | -0.225 | -0.539 | -0.825 | -0.812 | -0.837 | -0.903 | -1.124 | -1.136 |
| -N-P | 0.000 | -0.118 | -0.498 | -0.411 | -0.719 | -0.595 | -0.545 | -0.757 | -0.689 |
|
-N+P: Nitrogen starved in the presence of P-factor -N-P: Nitrogen starved in the absence of P-factor |