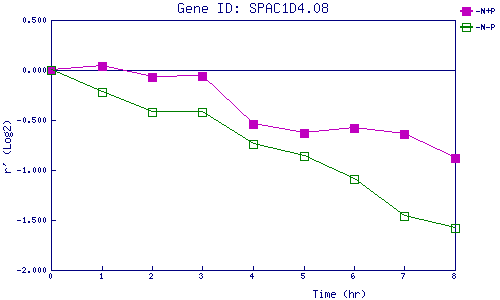
| 0 | 1 | 2 | 3 | 4 | 5 | 6 | 7 | 8 | |
| -N+P | 0.000 | 0.040 | -0.072 | -0.059 | -0.542 | -0.626 | -0.583 | -0.640 | -0.876 |
| -N-P | 0.000 | -0.216 | -0.425 | -0.418 | -0.742 | -0.862 | -1.092 | -1.457 | -1.583 |
|
-N+P: Nitrogen starved in the presence of P-factor -N-P: Nitrogen starved in the absence of P-factor |