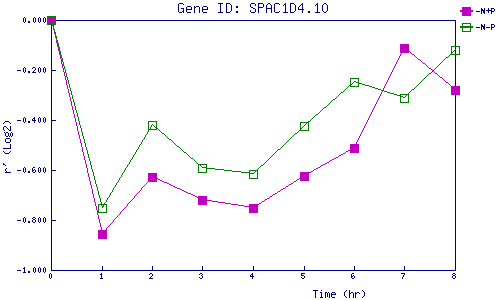
| 0 | 1 | 2 | 3 | 4 | 5 | 6 | 7 | 8 | |
| -N+P | 0.000 | -0.854 | -0.628 | -0.719 | -0.753 | -0.622 | -0.510 | -0.112 | -0.278 |
| -N-P | 0.000 | -0.752 | -0.421 | -0.593 | -0.618 | -0.422 | -0.247 | -0.312 | -0.121 |
|
-N+P: Nitrogen starved in the presence of P-factor -N-P: Nitrogen starved in the absence of P-factor |