lkh1 kic1
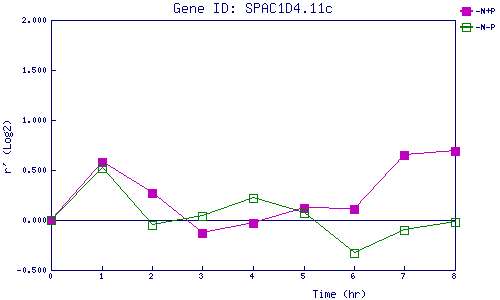
| 0 | 1 | 2 | 3 | 4 | 5 | 6 | 7 | 8 | |
| -N+P | 0.000 | 0.582 | 0.267 | -0.133 | -0.034 | 0.119 | 0.113 | 0.646 | 0.691 |
| -N-P | 0.000 | 0.521 | -0.047 | 0.040 | 0.219 | 0.071 | -0.327 | -0.105 | -0.022 |
|
-N+P: Nitrogen starved in the presence of P-factor -N-P: Nitrogen starved in the absence of P-factor |