rad15 rhp3
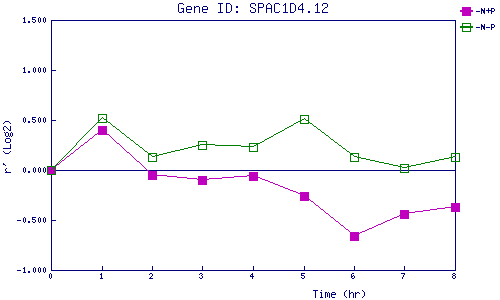
| 0 | 1 | 2 | 3 | 4 | 5 | 6 | 7 | 8 | |
| -N+P | 0.000 | 0.395 | -0.052 | -0.097 | -0.064 | -0.265 | -0.659 | -0.438 | -0.370 |
| -N-P | 0.000 | 0.515 | 0.130 | 0.251 | 0.232 | 0.510 | 0.132 | 0.021 | 0.132 |
|
-N+P: Nitrogen starved in the presence of P-factor -N-P: Nitrogen starved in the absence of P-factor |