p23fy
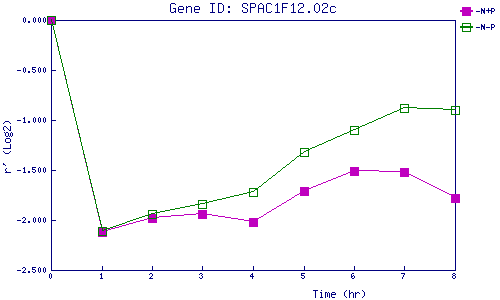
| 0 | 1 | 2 | 3 | 4 | 5 | 6 | 7 | 8 | |
| -N+P | 0.000 | -2.125 | -1.980 | -1.939 | -2.023 | -1.713 | -1.508 | -1.518 | -1.778 |
| -N-P | 0.000 | -2.112 | -1.942 | -1.836 | -1.720 | -1.316 | -1.104 | -0.885 | -0.899 |
|
-N+P: Nitrogen starved in the presence of P-factor -N-P: Nitrogen starved in the absence of P-factor |