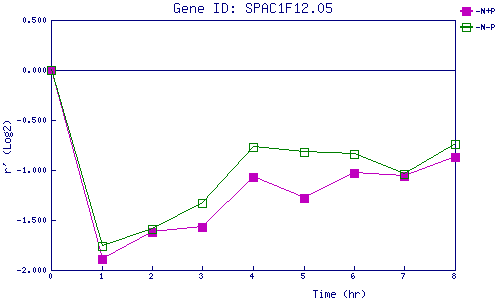
| 0 | 1 | 2 | 3 | 4 | 5 | 6 | 7 | 8 | |
| -N+P | 0.000 | -1.894 | -1.622 | -1.569 | -1.072 | -1.277 | -1.028 | -1.059 | -0.874 |
| -N-P | 0.000 | -1.761 | -1.593 | -1.327 | -0.771 | -0.825 | -0.835 | -1.038 | -0.737 |
|
-N+P: Nitrogen starved in the presence of P-factor -N-P: Nitrogen starved in the absence of P-factor |