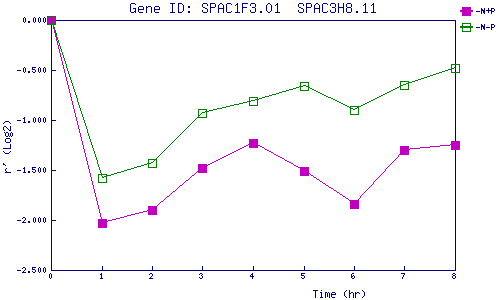
| 0 | 1 | 2 | 3 | 4 | 5 | 6 | 7 | 8 | |
| -N+P | 0.000 | -2.029 | -1.904 | -1.482 | -1.234 | -1.514 | -1.837 | -1.304 | -1.249 |
| -N-P | 0.000 | -1.580 | -1.429 | -0.931 | -0.814 | -0.658 | -0.900 | -0.651 | -0.482 |
|
-N+P: Nitrogen starved in the presence of P-factor -N-P: Nitrogen starved in the absence of P-factor |