spo15
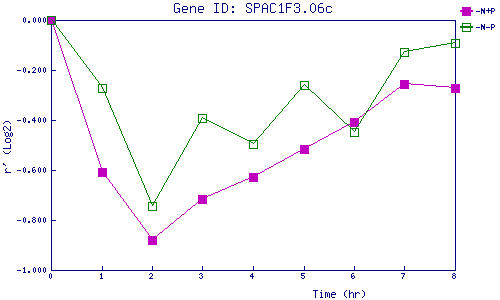
| 0 | 1 | 2 | 3 | 4 | 5 | 6 | 7 | 8 | |
| -N+P | 0.000 | -0.607 | -0.881 | -0.715 | -0.629 | -0.517 | -0.408 | -0.256 | -0.274 |
| -N-P | 0.000 | -0.271 | -0.742 | -0.391 | -0.496 | -0.259 | -0.449 | -0.129 | -0.091 |
|
-N+P: Nitrogen starved in the presence of P-factor -N-P: Nitrogen starved in the absence of P-factor |