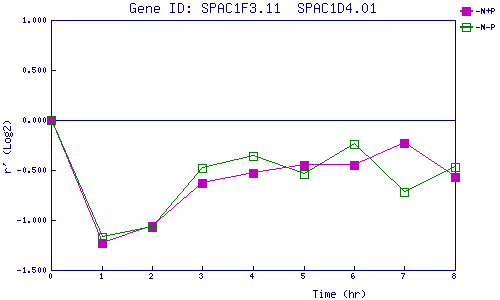
| 0 | 1 | 2 | 3 | 4 | 5 | 6 | 7 | 8 | |
| -N+P | 0.000 | -1.228 | -1.056 | -0.632 | -0.533 | -0.447 | -0.452 | -0.231 | -0.567 |
| -N-P | 0.000 | -1.166 | -1.068 | -0.479 | -0.356 | -0.537 | -0.244 | -0.721 | -0.466 |
|
-N+P: Nitrogen starved in the presence of P-factor -N-P: Nitrogen starved in the absence of P-factor |