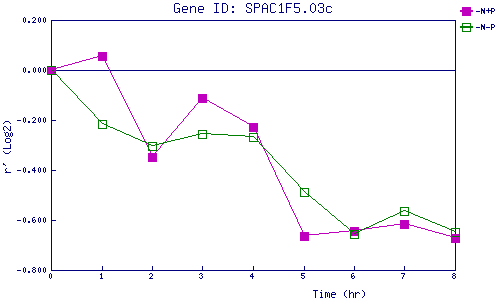
| 0 | 1 | 2 | 3 | 4 | 5 | 6 | 7 | 8 | |
| -N+P | 0.000 | 0.058 | -0.348 | -0.111 | -0.227 | -0.663 | -0.643 | -0.614 | -0.674 |
| -N-P | 0.000 | -0.218 | -0.306 | -0.256 | -0.269 | -0.486 | -0.657 | -0.563 | -0.647 |
|
-N+P: Nitrogen starved in the presence of P-factor -N-P: Nitrogen starved in the absence of P-factor |