tif412
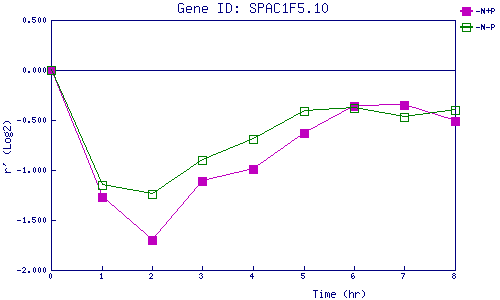
| 0 | 1 | 2 | 3 | 4 | 5 | 6 | 7 | 8 | |
| -N+P | 0.000 | -1.270 | -1.705 | -1.113 | -0.991 | -0.634 | -0.364 | -0.353 | -0.509 |
| -N-P | 0.000 | -1.153 | -1.238 | -0.897 | -0.694 | -0.413 | -0.378 | -0.469 | -0.395 |
|
-N+P: Nitrogen starved in the presence of P-factor -N-P: Nitrogen starved in the absence of P-factor |