fio1
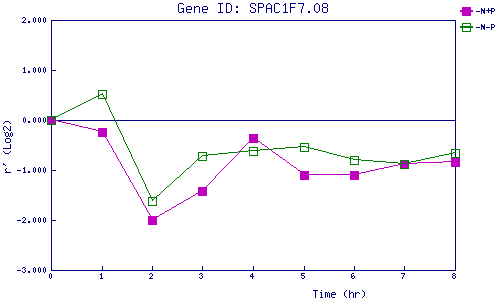
| 0 | 1 | 2 | 3 | 4 | 5 | 6 | 7 | 8 | |
| -N+P | 0.000 | -0.247 | -2.006 | -1.424 | -0.350 | -1.098 | -1.091 | -0.884 | -0.839 |
| -N-P | 0.000 | 0.523 | -1.611 | -0.727 | -0.614 | -0.540 | -0.792 | -0.885 | -0.651 |
|
-N+P: Nitrogen starved in the presence of P-factor -N-P: Nitrogen starved in the absence of P-factor |