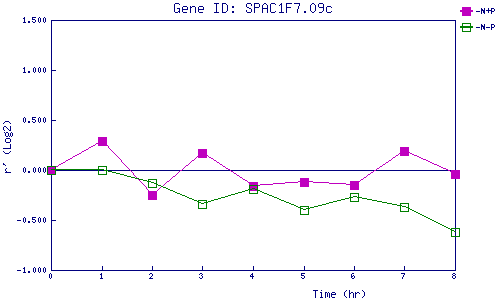
| 0 | 1 | 2 | 3 | 4 | 5 | 6 | 7 | 8 | |
| -N+P | 0.000 | 0.290 | -0.251 | 0.168 | -0.161 | -0.115 | -0.149 | 0.194 | -0.042 |
| -N-P | 0.000 | -0.001 | -0.130 | -0.340 | -0.187 | -0.401 | -0.267 | -0.371 | -0.618 |
|
-N+P: Nitrogen starved in the presence of P-factor -N-P: Nitrogen starved in the absence of P-factor |