| 0 | 1 | 2 | 3 | 4 | 5 | 6 | 7 | 8 | |
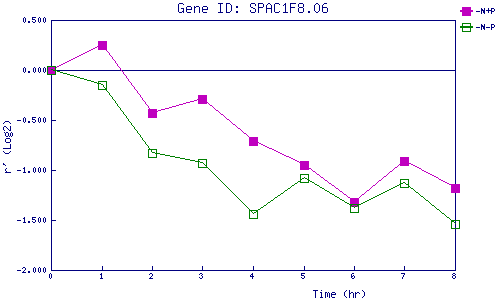
| -N+P | 0.000 | 0.250 | -0.432 | -0.292 | -0.708 | -0.946 | -1.317 | -0.910 | -1.179 |
| -N-P | 0.000 | -0.150 | -0.828 | -0.932 | -1.444 | -1.083 | -1.383 | -1.127 | -1.544 |
|
-N+P: Nitrogen starved in the presence of P-factor -N-P: Nitrogen starved in the absence of P-factor |