| 0 | 1 | 2 | 3 | 4 | 5 | 6 | 7 | 8 | |
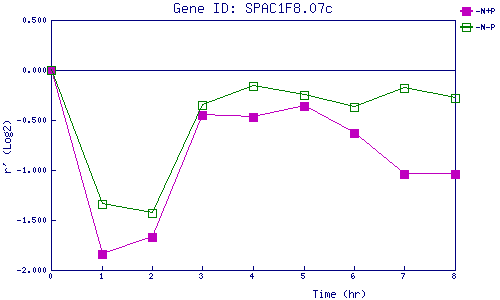
| -N+P | 0.000 | -1.837 | -1.667 | -0.449 | -0.471 | -0.365 | -0.633 | -1.041 | -1.045 |
| -N-P | 0.000 | -1.341 | -1.430 | -0.352 | -0.162 | -0.250 | -0.367 | -0.177 | -0.280 |
|
-N+P: Nitrogen starved in the presence of P-factor -N-P: Nitrogen starved in the absence of P-factor |