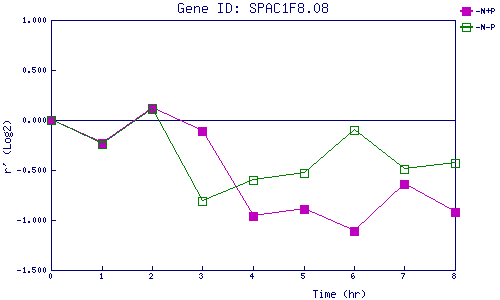
| 0 | 1 | 2 | 3 | 4 | 5 | 6 | 7 | 8 | |
| -N+P | 0.000 | -0.229 | 0.123 | -0.107 | -0.961 | -0.889 | -1.114 | -0.641 | -0.922 |
| -N-P | 0.000 | -0.239 | 0.108 | -0.808 | -0.595 | -0.534 | -0.097 | -0.487 | -0.434 |
|
-N+P: Nitrogen starved in the presence of P-factor -N-P: Nitrogen starved in the absence of P-factor |