hus1
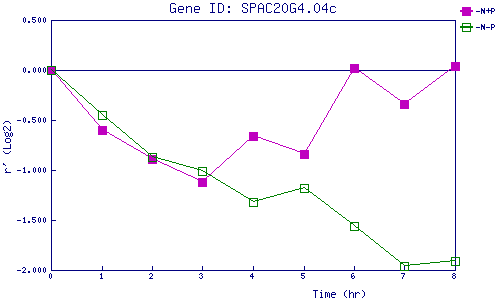
| 0 | 1 | 2 | 3 | 4 | 5 | 6 | 7 | 8 | |
| -N+P | 0.000 | -0.598 | -0.893 | -1.122 | -0.664 | -0.845 | 0.018 | -0.335 | 0.042 |
| -N-P | 0.000 | -0.448 | -0.866 | -1.007 | -1.319 | -1.178 | -1.561 | -1.960 | -1.913 |
|
-N+P: Nitrogen starved in the presence of P-factor -N-P: Nitrogen starved in the absence of P-factor |