| 0 | 1 | 2 | 3 | 4 | 5 | 6 | 7 | 8 | |
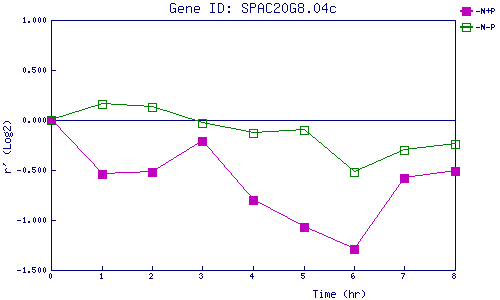
| -N+P | 0.000 | -0.541 | -0.517 | -0.211 | -0.796 | -1.067 | -1.293 | -0.583 | -0.510 |
| -N-P | 0.000 | 0.155 | 0.128 | -0.029 | -0.132 | -0.095 | -0.518 | -0.304 | -0.245 |
|
-N+P: Nitrogen starved in the presence of P-factor -N-P: Nitrogen starved in the absence of P-factor |