cdc15
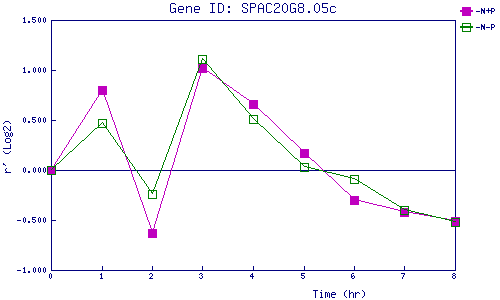
| 0 | 1 | 2 | 3 | 4 | 5 | 6 | 7 | 8 | |
| -N+P | 0.000 | 0.805 | -0.632 | 1.020 | 0.665 | 0.172 | -0.297 | -0.423 | -0.510 |
| -N-P | 0.000 | 0.474 | -0.237 | 1.109 | 0.509 | 0.030 | -0.088 | -0.404 | -0.518 |
|
-N+P: Nitrogen starved in the presence of P-factor -N-P: Nitrogen starved in the absence of P-factor |