| 0 | 1 | 2 | 3 | 4 | 5 | 6 | 7 | 8 | |
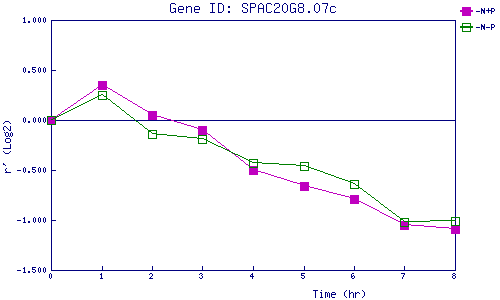
| -N+P | 0.000 | 0.346 | 0.048 | -0.097 | -0.502 | -0.658 | -0.794 | -1.052 | -1.093 |
| -N-P | 0.000 | 0.250 | -0.139 | -0.188 | -0.434 | -0.462 | -0.645 | -1.021 | -1.014 |
|
-N+P: Nitrogen starved in the presence of P-factor -N-P: Nitrogen starved in the absence of P-factor |