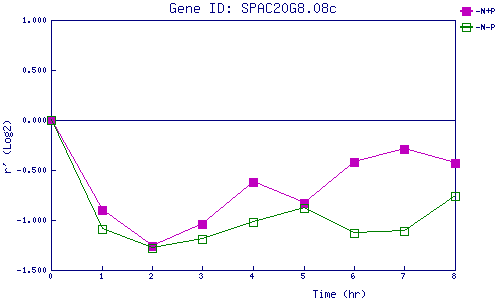
| 0 | 1 | 2 | 3 | 4 | 5 | 6 | 7 | 8 | |
| -N+P | 0.000 | -0.902 | -1.262 | -1.035 | -0.617 | -0.834 | -0.415 | -0.290 | -0.428 |
| -N-P | 0.000 | -1.094 | -1.280 | -1.193 | -1.021 | -0.884 | -1.128 | -1.114 | -0.756 |
|
-N+P: Nitrogen starved in the presence of P-factor -N-P: Nitrogen starved in the absence of P-factor |