| 0 | 1 | 2 | 3 | 4 | 5 | 6 | 7 | 8 | |
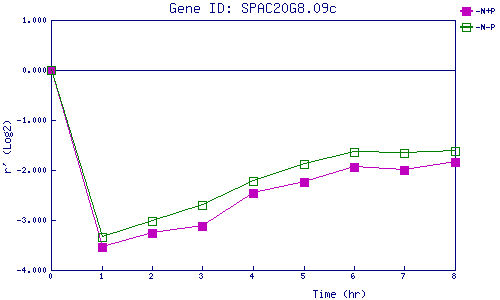
| -N+P | 0.000 | -3.548 | -3.259 | -3.122 | -2.461 | -2.249 | -1.940 | -1.994 | -1.844 |
| -N-P | 0.000 | -3.341 | -3.019 | -2.691 | -2.218 | -1.890 | -1.639 | -1.655 | -1.627 |
|
-N+P: Nitrogen starved in the presence of P-factor -N-P: Nitrogen starved in the absence of P-factor |