tfs1
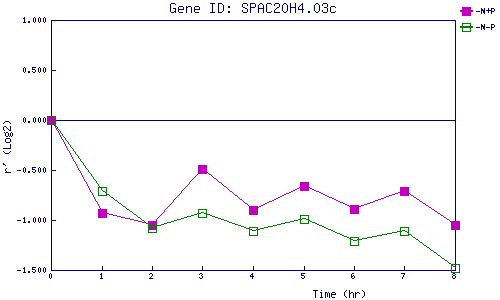
| 0 | 1 | 2 | 3 | 4 | 5 | 6 | 7 | 8 | |
| -N+P | 0.000 | -0.932 | -1.053 | -0.494 | -0.897 | -0.661 | -0.893 | -0.714 | -1.048 |
| -N-P | 0.000 | -0.709 | -1.083 | -0.930 | -1.109 | -0.989 | -1.213 | -1.112 | -1.480 |
|
-N+P: Nitrogen starved in the presence of P-factor -N-P: Nitrogen starved in the absence of P-factor |