| 0 | 1 | 2 | 3 | 4 | 5 | 6 | 7 | 8 | |
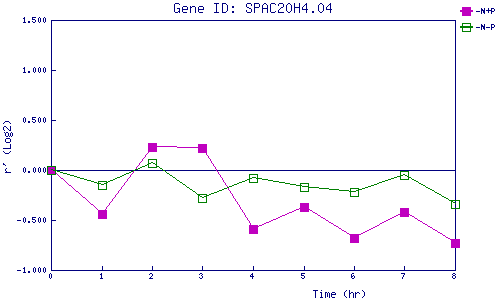
| -N+P | 0.000 | -0.435 | 0.230 | 0.215 | -0.590 | -0.371 | -0.676 | -0.422 | -0.726 |
| -N-P | 0.000 | -0.153 | 0.074 | -0.282 | -0.079 | -0.171 | -0.224 | -0.047 | -0.336 |
|
-N+P: Nitrogen starved in the presence of P-factor -N-P: Nitrogen starved in the absence of P-factor |