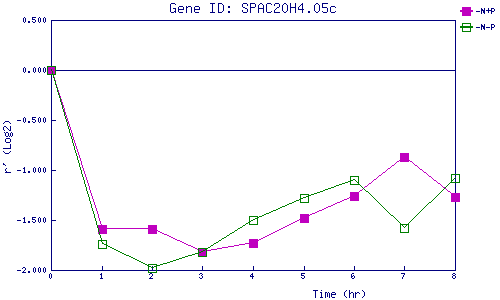
| 0 | 1 | 2 | 3 | 4 | 5 | 6 | 7 | 8 | |
| -N+P | 0.000 | -1.590 | -1.591 | -1.815 | -1.726 | -1.481 | -1.262 | -0.870 | -1.271 |
| -N-P | 0.000 | -1.736 | -1.978 | -1.822 | -1.499 | -1.285 | -1.100 | -1.582 | -1.083 |
|
-N+P: Nitrogen starved in the presence of P-factor -N-P: Nitrogen starved in the absence of P-factor |