| 0 | 1 | 2 | 3 | 4 | 5 | 6 | 7 | 8 | |
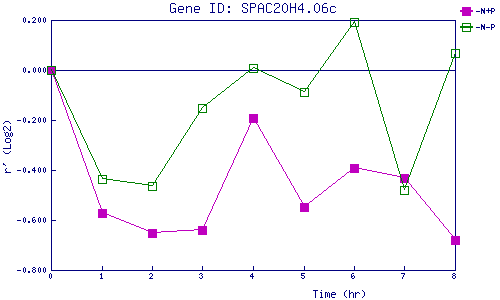
| -N+P | 0.000 | -0.571 | -0.651 | -0.640 | -0.193 | -0.547 | -0.390 | -0.430 | -0.679 |
| -N-P | 0.000 | -0.437 | -0.466 | -0.153 | 0.007 | -0.088 | 0.191 | -0.479 | 0.069 |
|
-N+P: Nitrogen starved in the presence of P-factor -N-P: Nitrogen starved in the absence of P-factor |