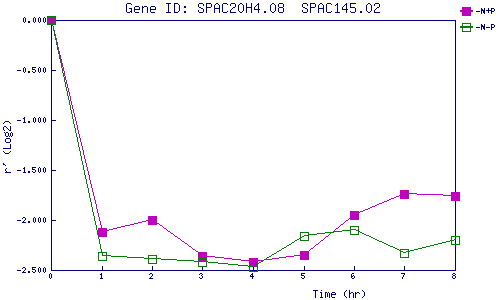
| 0 | 1 | 2 | 3 | 4 | 5 | 6 | 7 | 8 | |
| -N+P | 0.000 | -2.120 | -1.999 | -2.361 | -2.419 | -2.351 | -1.949 | -1.742 | -1.762 |
| -N-P | 0.000 | -2.363 | -2.388 | -2.415 | -2.469 | -2.156 | -2.097 | -2.326 | -2.196 |
|
-N+P: Nitrogen starved in the presence of P-factor -N-P: Nitrogen starved in the absence of P-factor |