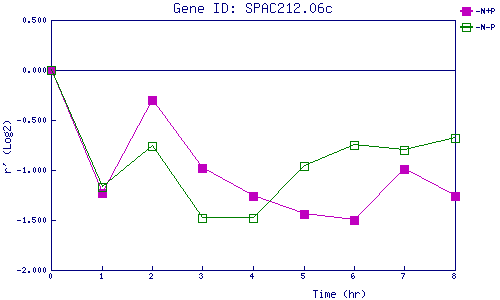
| 0 | 1 | 2 | 3 | 4 | 5 | 6 | 7 | 8 | |
| -N+P | 0.000 | -1.231 | -0.297 | -0.981 | -1.265 | -1.439 | -1.503 | -0.988 | -1.262 |
| -N-P | 0.000 | -1.174 | -0.762 | -1.480 | -1.475 | -0.962 | -0.747 | -0.802 | -0.675 |
|
-N+P: Nitrogen starved in the presence of P-factor -N-P: Nitrogen starved in the absence of P-factor |