ppr1
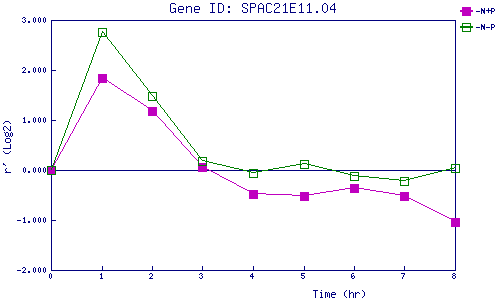
| 0 | 1 | 2 | 3 | 4 | 5 | 6 | 7 | 8 | |
| -N+P | 0.000 | 1.835 | 1.174 | 0.054 | -0.478 | -0.520 | -0.366 | -0.512 | -1.031 |
| -N-P | 0.000 | 2.761 | 1.490 | 0.171 | -0.065 | 0.111 | -0.126 | -0.227 | 0.040 |
|
-N+P: Nitrogen starved in the presence of P-factor -N-P: Nitrogen starved in the absence of P-factor |