cyp8
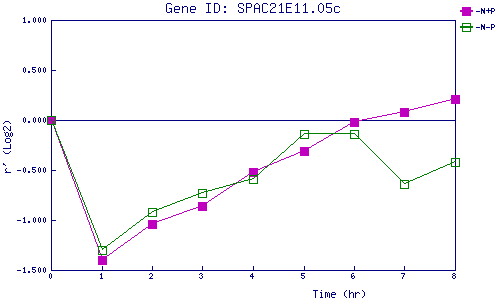
| 0 | 1 | 2 | 3 | 4 | 5 | 6 | 7 | 8 | |
| -N+P | 0.000 | -1.399 | -1.042 | -0.861 | -0.516 | -0.307 | -0.019 | 0.082 | 0.213 |
| -N-P | 0.000 | -1.298 | -0.915 | -0.727 | -0.591 | -0.137 | -0.142 | -0.639 | -0.415 |
|
-N+P: Nitrogen starved in the presence of P-factor -N-P: Nitrogen starved in the absence of P-factor |