tif224
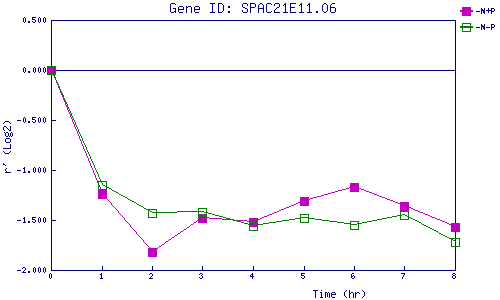
| 0 | 1 | 2 | 3 | 4 | 5 | 6 | 7 | 8 | |
| -N+P | 0.000 | -1.239 | -1.815 | -1.477 | -1.517 | -1.309 | -1.172 | -1.359 | -1.567 |
| -N-P | 0.000 | -1.151 | -1.433 | -1.424 | -1.555 | -1.484 | -1.546 | -1.453 | -1.718 |
|
-N+P: Nitrogen starved in the presence of P-factor -N-P: Nitrogen starved in the absence of P-factor |