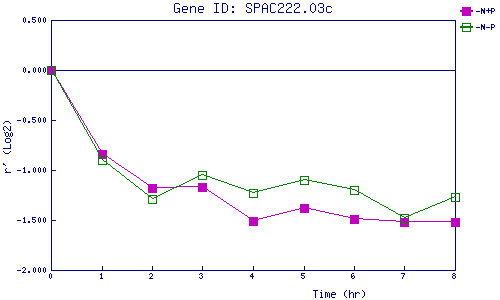
| 0 | 1 | 2 | 3 | 4 | 5 | 6 | 7 | 8 | |
| -N+P | 0.000 | -0.839 | -1.184 | -1.171 | -1.511 | -1.380 | -1.493 | -1.517 | -1.522 |
| -N-P | 0.000 | -0.904 | -1.290 | -1.046 | -1.234 | -1.100 | -1.201 | -1.475 | -1.266 |
|
-N+P: Nitrogen starved in the presence of P-factor -N-P: Nitrogen starved in the absence of P-factor |